Why every % change on a dashboard needs "compared to what"
A percentage on its own can't be read. Up 45% since when? Here's the small fix I'd make first.
 Moin HaiderUI/UX designer for SaaS & fintech dashboards
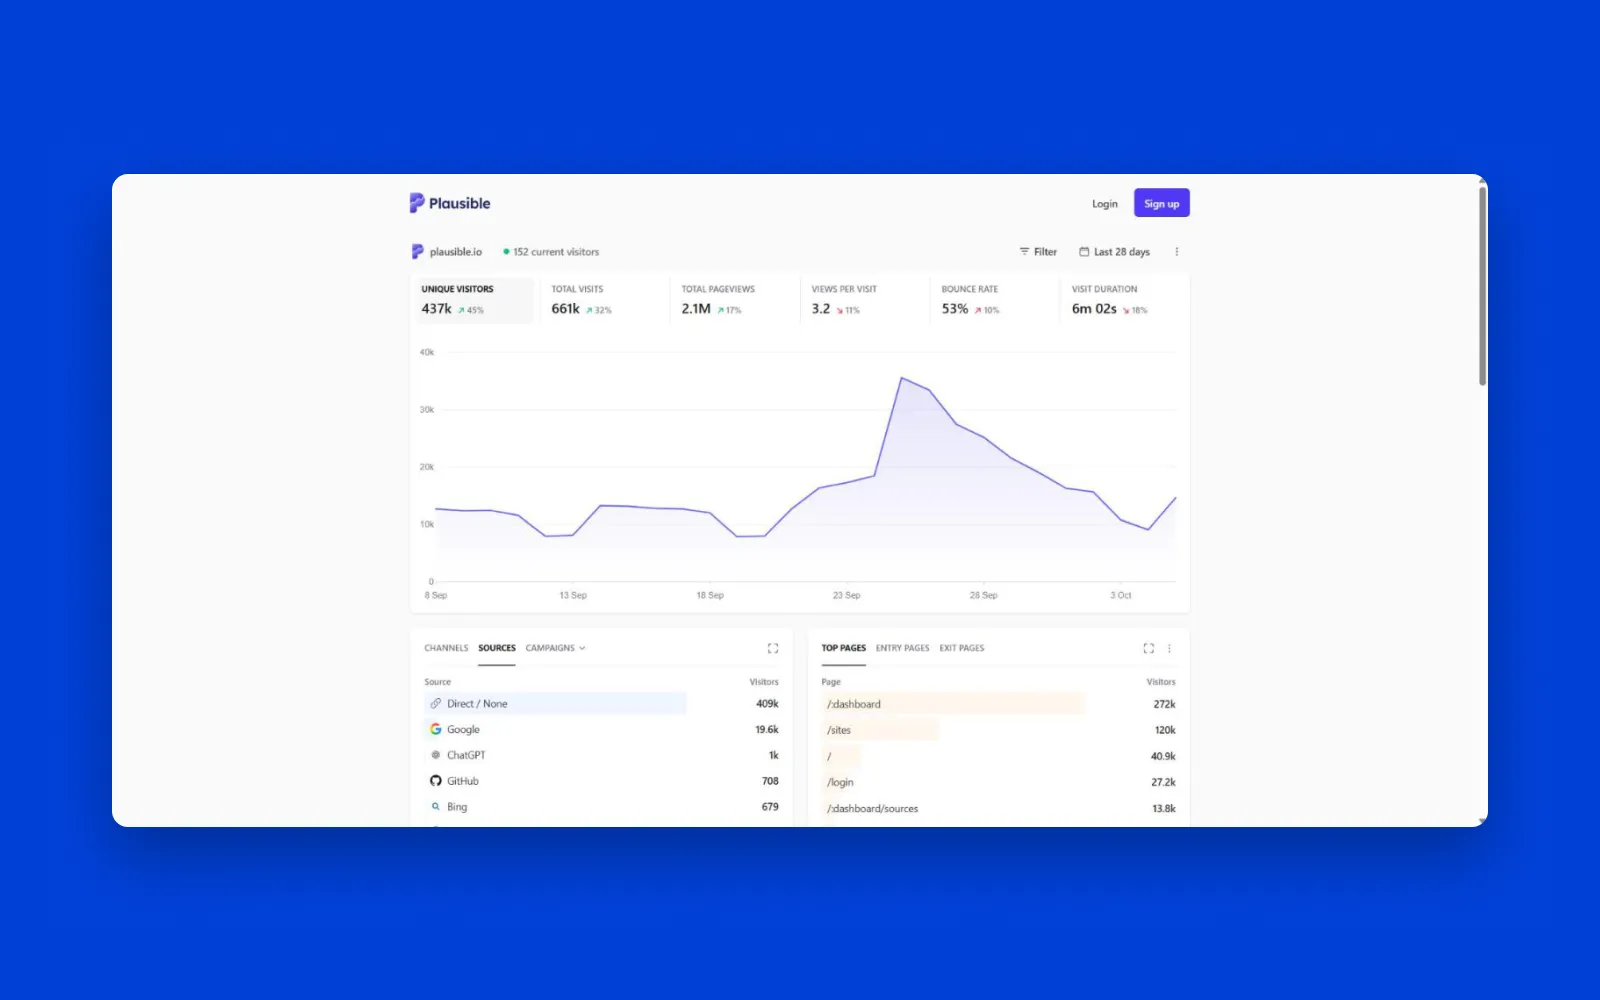
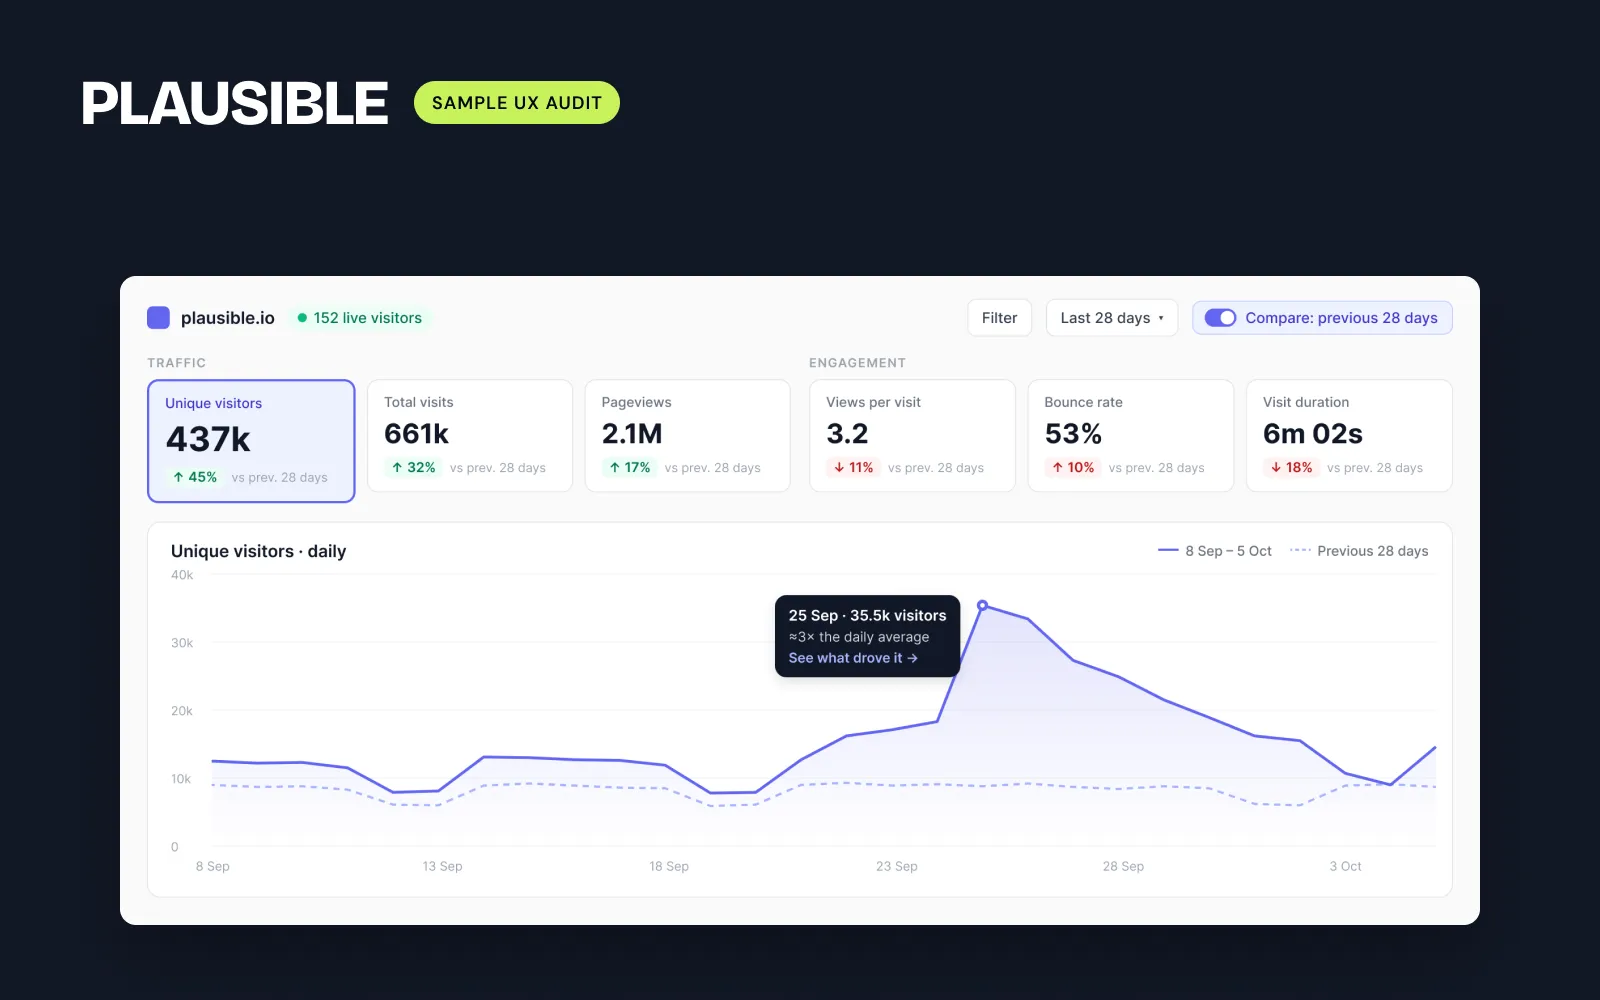
When I audited Plausible's public dashboard in October, one of the first things I noted was a number: "↗ 45%" under unique visitors. It looked like good news. But I couldn't tell what it was compared to. Hovering showed the exact number, not the period. Was it last month? Last year? The previous 28 days?
A founder looking at that card has to guess. If they guess wrong, they make a decision on the wrong idea.
The fix is one line of text
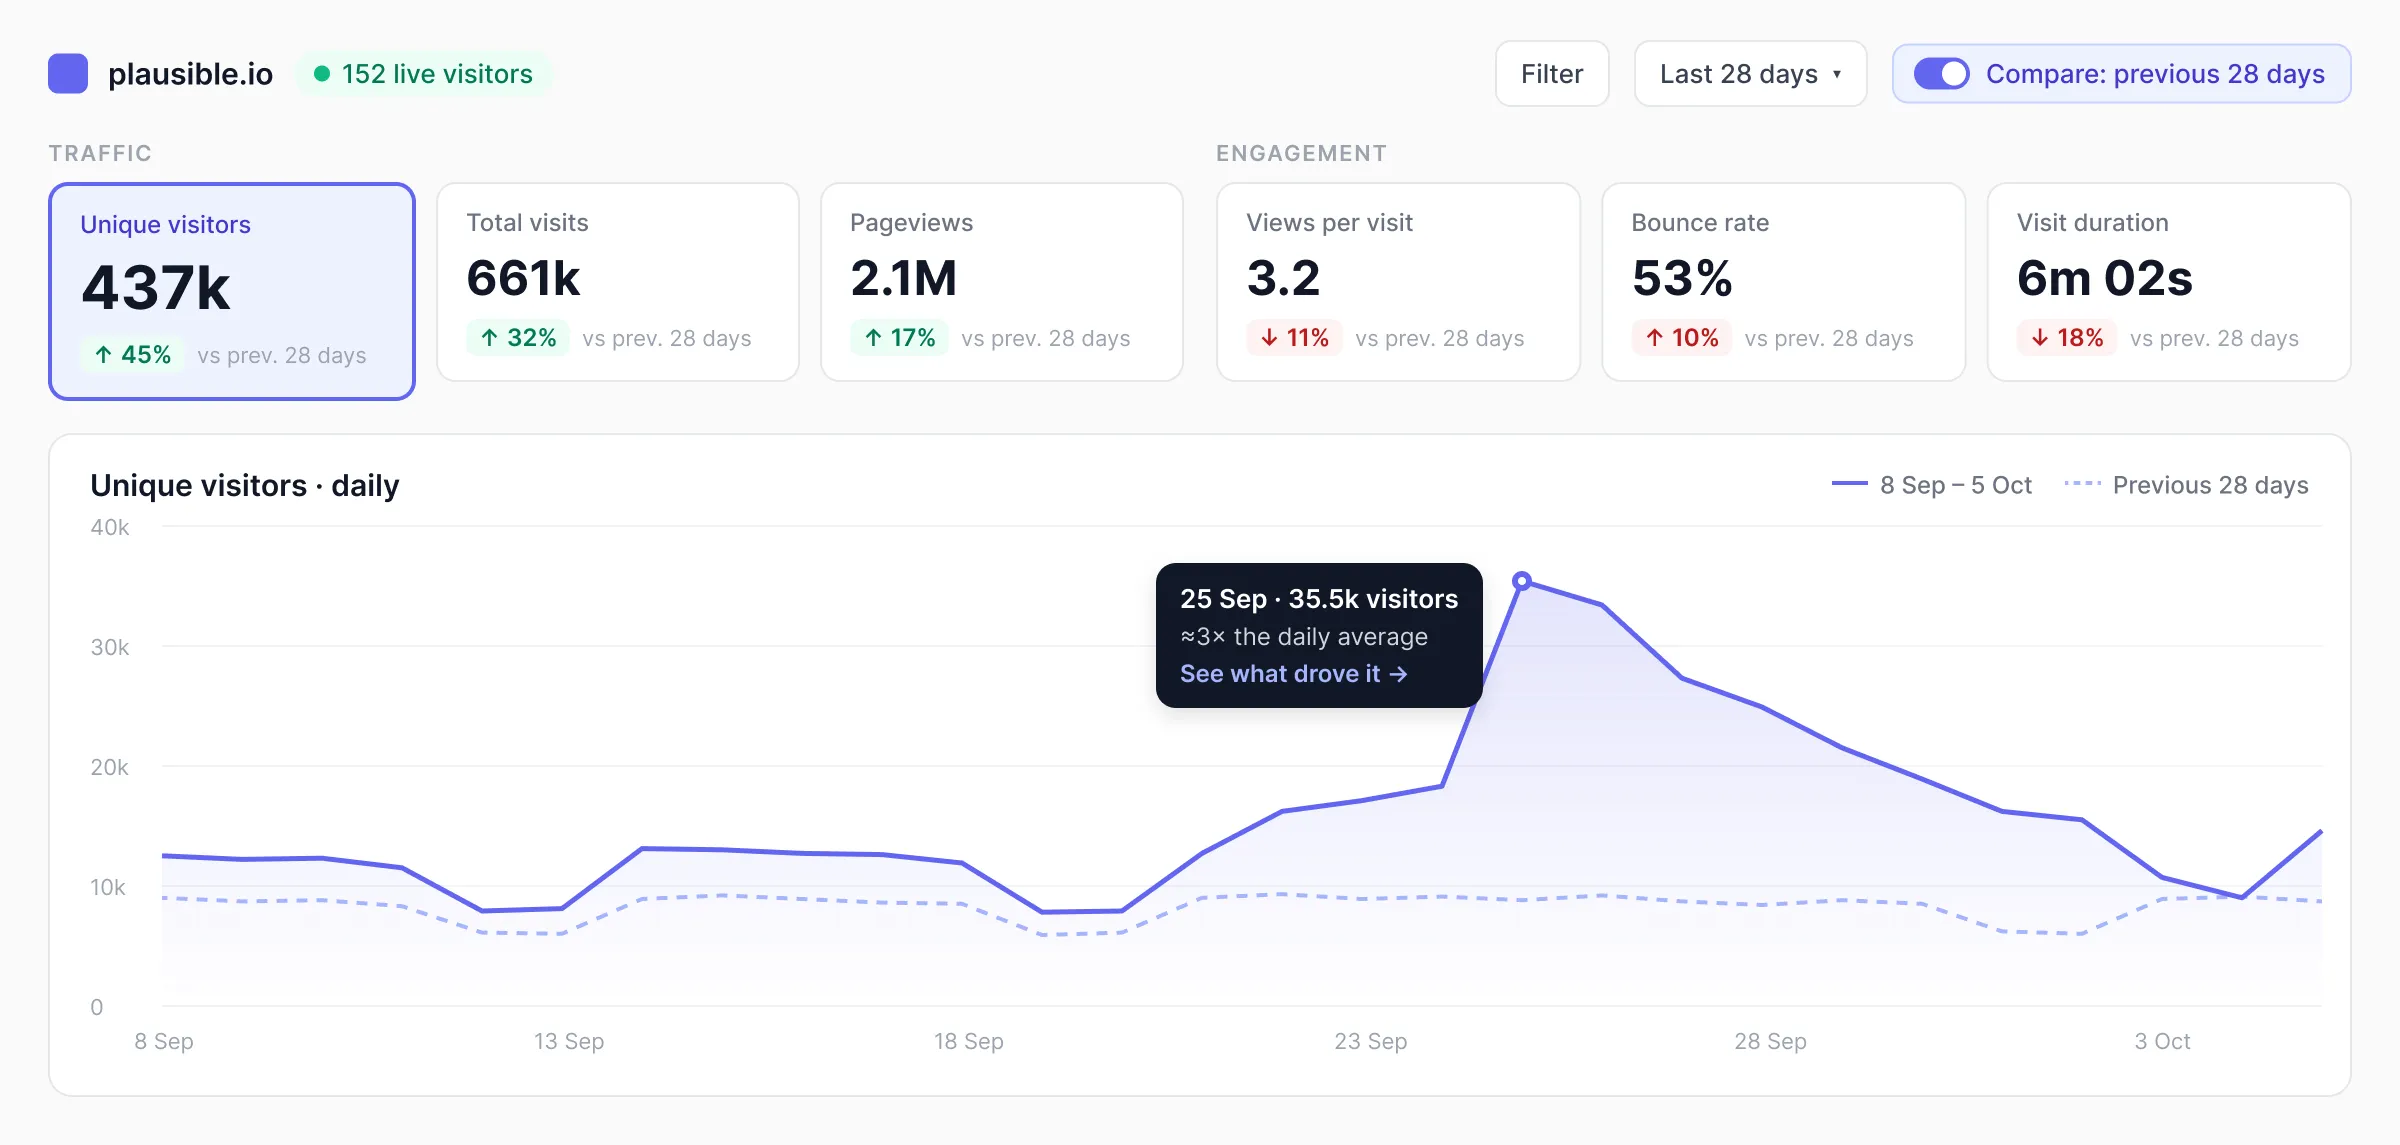
Under each KPI, say what the change is measured against, for example "vs previous 28 days". If every card uses the same period, one caption under the whole row is enough. In my Plausible redesign each card got a short "vs prev. 28 days" next to the change, in a quieter grey so it doesn't compete with the number itself.
Some products already get this right
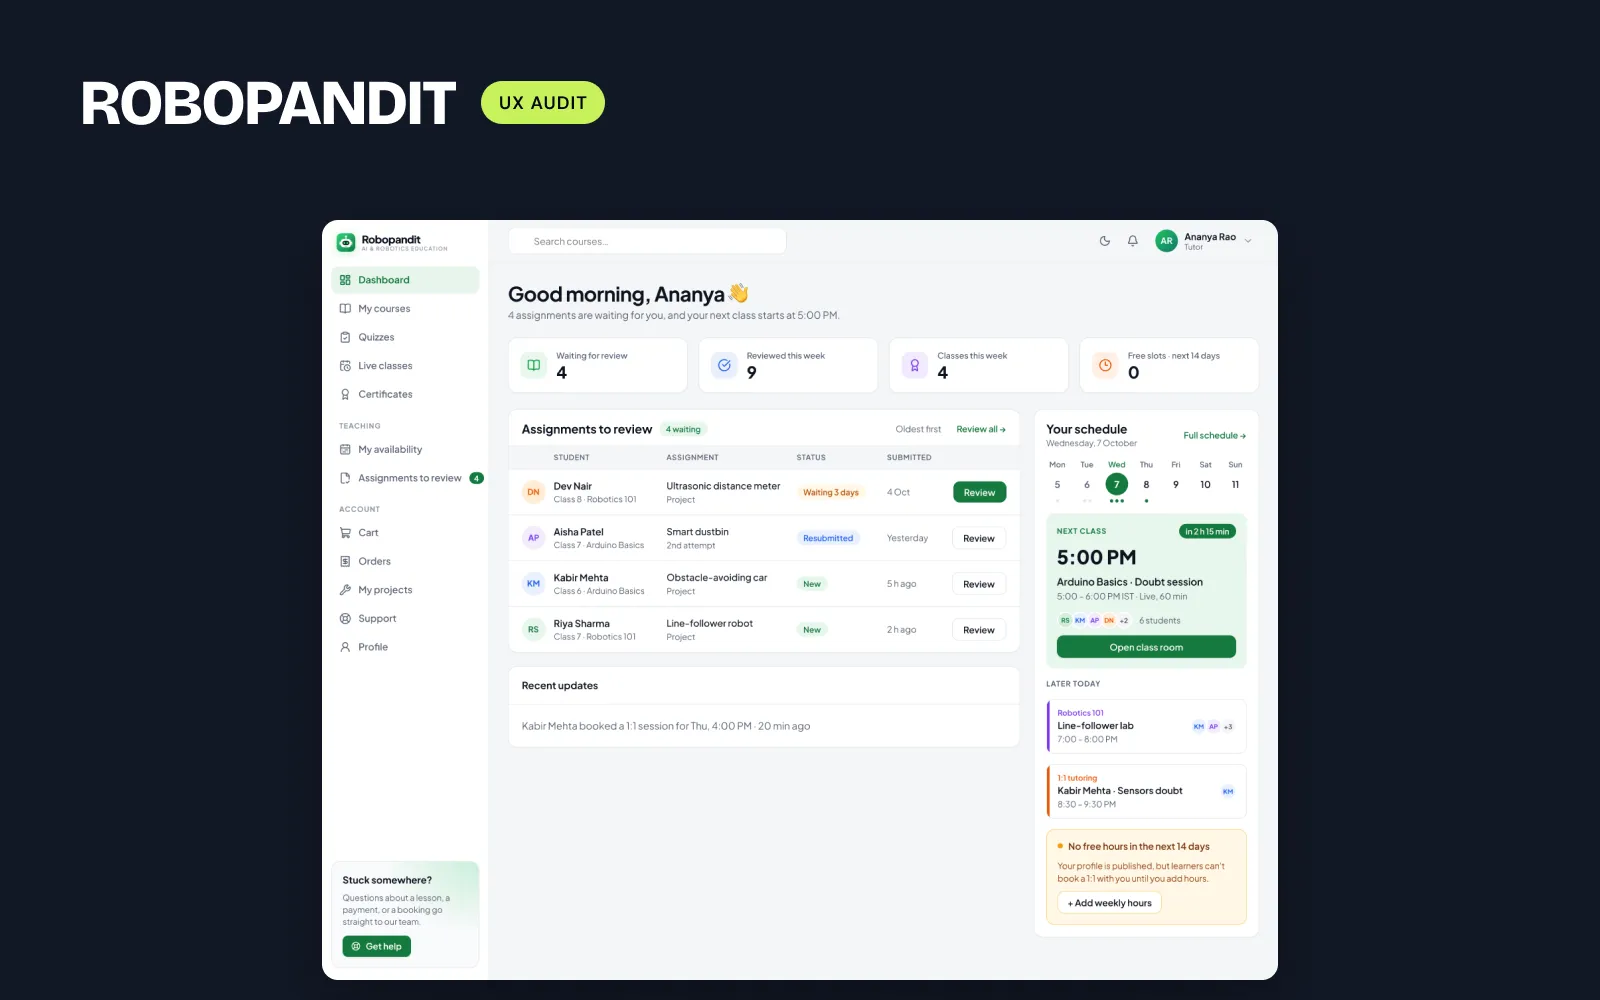
RoboPandit, a tutoring platform I audited with the founder's permission, already labels its KPIs "vs previous 7 days". It was one of the strengths I listed in the report, and I kept it in the redesign. In Recova, a failed payments dashboard I designed as a concept, the money at risk card says "12.4% vs September", because founders think about failed payments month by month.
Three things to check on your own dashboard
- Every % or arrow has a reference period next to it, or one caption covers the whole row.
- The reference follows the date picker. If someone picks "Last 7 days", the comparison should switch to the previous 7 days too.
- The colour follows meaning, not direction. Bounce rate going up is bad news, so it shouldn't turn green just because the arrow points up. Plausible already does this well.
None of this needs new data. The comparison is already calculated somewhere in the product. It just isn't written on the screen yet.